

- 21/09/2020
- Posted by: Valerie Vaz MP
- Category: News
Sir Patrick Vallance and Professor Chris Whitty delivered an important coronavirus data briefing on Monday 21 September 2020. You can read a full transcript of this briefing below:
Sir Patrick Vallance, Government Chief Scientific Adviser: Good morning everybody. I’m Patrick Vallance, the government Chief Scientific Adviser and I’m here with Chris Whitty, the Chief Medical Officer and we wanted to give you an update on where we see the epidemic at the moment, some of the knowns and some of the uncertainties.
Let me just start by reminding you that this disease spreads by droplets, by surface contact and by aerosols. Hence the hands, face, space but also to remind you that the way that we reduce the spread is by limiting our number of contacts, by reducing contact in environments where spread is more likely. Those are crowded environments, indoor environments, poor ventilation. And making sure that we reduce the probability of coming into contact with anyone who is infectious and that’s the importance of self-isolation, keeping out of circulation if you have or may have the virus. May I have the first slide please?
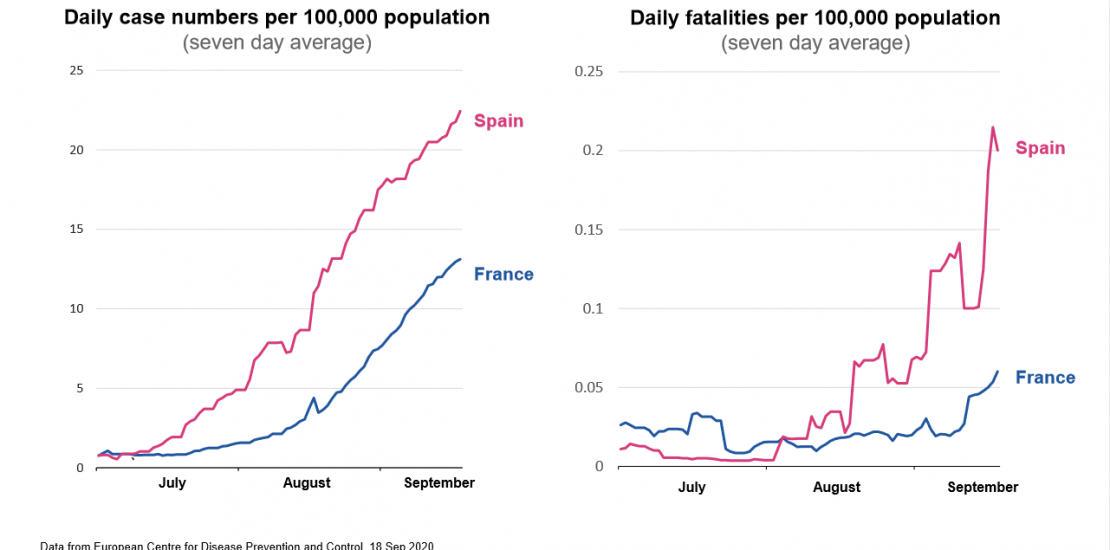
I want to start by talking about the rise in cases elsewhere and what we can learn. We’ve seen increase in cases across Europe, and here I’ve taken examples of Spain and France. We have seen an increase in the numbers of cases. It started with younger people in their twenties and spread gradually to older ages as well. That increase in case number has translated into an increase in hospitalisations. As the hospitalisations have increased, as you look at the slide on the right here, you will see that very sadly but not unexpectedly, deaths are also increasing. So there’s a simple message from this slide, which is that as the disease spreads, as it spreads across age groups, we expect to see increase in hospitalisations and unfortunately those increase in hospitalisations will lead to an increase in deaths. The virus has genetically moved a bit but it has not changed in terms of its propensity and its ability to cause disease and to cause death, even though of course most of the disease deaths occur in the older population. So where are we here? Next slide, please.
These are data from testing and I’ll come back to that point in a minute and they’re data for England but the picture is fairly similar across the UK and, and Chris Whitty will say more about that. What we see from July, as we look at the increase in cases per 100,000 of population, an increase which has occurred over August and has increased into September. This is by different age groups and the top line, the blue line is amongst the 20 to 29-year-olds. But what you can see is there has been an increase in cases across all age groups. The lowest increase has been in children and in the population aged 70 to 79 but in every age group we’ve seen an increase. Could that increase be due to increased testing? The answer is no. We see an increase in positivity of the tests done, so we see the proportion of people testing positive has increased even if testing stays flat. And if we look at other sources of data such as, for example, the ONS study which takes a sample of people across the population and looks at it or studies like the REACT study we see a similar increase. In the ONS study, it’s now estimated that roughly 70,000 people in the UK have Covid infection and that about 6,000 people per day are getting the infection. So we are in a situation where numbers are clearly increasing. They’re increasing across all age groups. It’s a little bit different in different areas, in terms of geographies and Chris will speak to that and this increase in numbers is also translating into an increase in hospitalisation, which Chris will say more about. So there’s no doubt we are in a situation where the numbers are increasing. What I’d like to do is just remind you how quickly this can move. So the next slide is not a prediction, but it is a way of thinking about how quickly this can change.
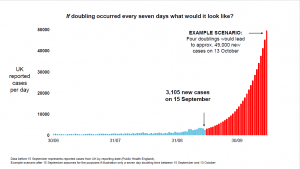
So this is the UK reported cases per day against time and you can see running along the bottom there the number of cases over June, July and August. Up to roughly 3,000 cases per day or so in September, middle of September. At the moment, we think that the epidemic is doubling roughly every seven days. It could be a little bit longer, maybe a little shorter, but let’s say roughly every seven days. If, and that’s quite a big if, but if that continues unabated and this grows, doubling every seven days, then what you see of course, let’s say that there were 5,000 today, it would be 10,000 next week, 20,000 the week after, 40,000 the week after. And you can see that by mid-October if that continued, you would end up with something like 50,000 cases in the middle of October per day. 50,000 cases per day would be expected to lead a month later, so the middle of November say, to 200 plus deaths per day. So this graph, which is not a prediction, is simply showing you how quickly this can move if the doubling time stays at seven days. And of course the challenge therefore is to make sure the doubling time does not stay at seven days. There’re already things in place which are expected to slow that. And to make sure that we do not enter into this exponential growth and end up with the problems that you would predict as a result of that. That requires speed, it requires action and it requires enough in order to be able to bring that down. One final word on this section. So as we see it, cases are increasing, hospitalisations are following. Deaths unfortunately will follow that, and there is the potential for this to move very fast. A word on immunity. Next slide, please.
When people have an infection, the vast majority of people get an antibody response, and we know that some of those antibodies are so-called neutralising antibodies. They do indeed protect against the virus. We also know that they fade over time, and there are cases of people becoming re-infected. So this is not an absolute protection, and it will potentially decrease over time. What we see is that something under eight per cent of the population have been infected as we measure the antibodies, so about eight per cent, so 3 million or so people, may have been infected and have antibodies. It means that the vast majority of us are not protected in any way and are susceptible to this disease. There may be other forms of protection that increase that number a little bit, other parts of the immune system, but it does mean the vast majority of the population remain susceptible, and therefore you’d expect spread throughout them. The number of people with antibodies is a little higher in the cities, and it may be as high as 17 per cent or so in London. That may confer a little slowing of spread but not much more than that. At that point I’ll pass over to Chris to take you through some of the other features of the epidemic. Chris.
Professor Chris Whitty, Chief Medical Officer for England: Thanks, Patrick. Next slide, please.
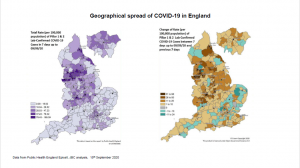
What we have here are two maps, they are from England but there would be similar ones from Scotland, Wales and Northern Ireland. What we have on the left here is a map where the darker colours are the rate of transmission, and on the right what we have is a map where orange or yellow or brown represent an increasing rate of transmission. The darker that colour, the greater the rate of increase, and green or blue represent a stable or falling situation. And what you can see in, on the left side is that at the moment the very high rates of transmission in the UK are highly concentrated in particular areas, but there are significant rates of transmission in many parts of the UK with the darker colours. But what we’ve seen is a progression where, after the remarkable efforts which got the rates right down across the country, firstly we saw very small outbreaks, might be associated with a workplace or another environment. Then we’ve seen more localised outbreaks which have got larger over time, particularly in the cities, and now what we’re seeing is a rate of increase across the great majority of the country. It’s growing at different rates but it is now increasing. And what we’ve found is that as the rate, as we go through in time, anywhere which was falling is now moving over to beginning to rise, and then the rate of rise continues in an upward direction. So this is not someone else’s problem, this is all of our problem. Next slide, please.
This graph is a simple one, it simply shows the number of inpatient cases in England over the period from the first of August. And until that point in time, there had been a steady fall over a long period of time, right back from early April. And it then stabilised for a period and flattened out, but over the period since the first of September, you can see a steady, sustained rise in numbers with a doubling time, as with the cases, of probably seven or eight days. Now what that tells us is that if this carried on unabated, these numbers are relatively small, we are talking about around 200 at the moment, but if this, if this continued along the path that Patrick laid out, the number of deaths directly from Covid, I’ll come back to indirect deaths, will continue to rise, potentially on an exponential curve. That means doubling and doubling and doubling again, and you can quickly move from really quite small numbers to really very large numbers because of that exponential process. So we have, in a bad sense, literally turned a corner, although only relatively recently. And we, I think everybody will realise that at this point the seasons are against us. We’re now going into the seasons late autumn and winter which benefit respiratory viruses, and it is very likely they will benefit Covid as they do for example flu. So we should see this as a six-month problem that we have to deal with collectively. It’s not indefinite and as I come on to, science will in due course come, ride to our rescue, but in this period of the next six months I think we have to realise we have to take this collectively, very seriously.
A lot of people have said maybe this is a milder virus than it was in April. I’m afraid, although that would be great if that were true, we see no evidence that is the case. At the moment, because the cases started to rise most in the lowest age bands, in young adults, not in children, children the rates have really not increased, as the data Patrick showed shows, showed in young children, but in young adults, these are the group who are least likely to end up in hospital. And a point we made right from the beginning is that for many people this remains a mild infection, but as you move up the ages, if you move into people who are more vulnerable, then the mortality rates, if people get this, rise to quite significant rates. And what we’ve seen in other countries, and are now clearly seeing here, is that they’re not staying just in the younger age groups, they’re moving up the age bands and the mortality rates will be similar to, slightly lower than they were previously, but they will be similar to what we saw previously. And these are significantly greater, for example, than ordinary seasonal flu. So seasonal flu normally in the UK would on average a year would kill around 7,000 people a year tragically, and in a bad flu year, as there was for example about three years ago, it might kill upward of 20,000 a year. This virus is more virulent than flu. So the numbers people talk about are not unreasonable numbers for us to be thinking about. Treatment is better, there is no doubt about that. Doctors, nurses have learned to treat this much more effectively and we have new drugs such as dexamethasone. These will reduce the mortality rate, but they will definitely not eliminate or take it right down to trivial levels.
Two other broad points I wanted to make. The first one is that there are, as we’ve said from the beginning, and it really does need to be repeated, four ways in which this virus is going to have a very potential significant effect on the population’s health if we let it grow out of control. The first, the easiest to, to identify, is direct Covid deaths. People who get the virus and die of the virus. The second would be if the NHS emergency services were overwhelmed by a huge spike, and that is what the extraordinary efforts of the population allowed to prevent happening in the first wave we met. The third however is very important, and I think its importance should not be understated, which is if the NHS is having to spend a large proportion of its effort in trying to treat Covid cases because the numbers have gone up very, to a very high levels and trying to put in case, in place, large numbers of systems to try and reduce the risk of transmission in hospitals, it will lead to a reduction in treatment for other areas, in early diagnosis of disease, and in prevention programmes. And so there is an indirect effect on deaths and on illness from this impact on the NHS if we allow the numbers to rise too fast. But on the other side, we also know that some of the things we’ve had to do are going to cause significant problems in the economy, big social impacts, impacts on mental health, and therefore ministers making decisions, and all of society, have to walk this very difficult balance. If we do too little, this virus will go out of control and we will get significant numbers of increased direct and indirect deaths, but if we go too far the other way, then we can cause damage to the economy which can feed through to unemployment, to poverty and to deprivation, all of which have long-term health effects. So we need always to keep these two sides in mind.
My final point is that if I increase my risk, a lot of people say, well, can’t people just be allowed to take their own risk? The problem with a pandemic or an epidemic infection like this is if I as an individual increase my risk, I increase the risk to everyone around me and then everyone who’s a contact of theirs, and sooner or later the chain will meet people who are vulnerable or elderly or have a long term problem from Covid. So you cannot in an epidemic just take your own risk. Unfortunately, you’re taking a risk on behalf of everybody else.
It’s important that we see this as something we have to do collectively, and there are broadly four things we can do, over the next period, to get on top of this. The first of which is reducing our individual risk, and this is around the things that we all know about, hands, face, space, washing hands, using masks, particularly in environments which are enclosed, public transport and so on, and also, in particular, having space between people whenever we can achieve it. Especially when indoors. The second group of things are things we can do to isolate the virus. So if people have symptoms they must self-isolate and we must find their contacts so that they can isolate, and in people who’ve travelled from high risk areas, they also should isolate, and this means that they are taking on behalf of society a big step forward to keep the virus out of circulation whilst they are still infectious. This is an absolutely critical part of the response. The third one, and in many ways the most difficult, is that we have to break unnecessary links between households, because that is the way in which this virus is transmitted, and this means reducing social contacts, whether they are at work, and this is where we have enormous gratitude to all the businesses, for example, who’ve worked so hard to make their environment Covid-secure to reduce the risk, and also in social environments. And we have to try and do this in the least damaging way, but we, we all know we cannot do this without some significant downsides, and this is, this is a balance of risk between if we don’t do enough the virus will take off, and we at the moment, that is the path that we are clearly on, and we, if we do not change course, then we’re going to find ourselves in a very difficult problem, as Patrick has laid out. The final thing we can do is the science, is investing in drugs, vaccines, diagnostics, and Patrick is going to take us through the final section, where we’ve got to with the most exciting of these, which is vaccines.
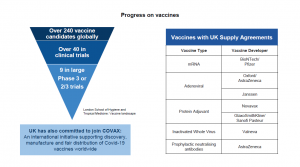
PV: Thank you very much. As Chris has said, we will be living with this vac, this virus. This is now circulating amongst the population worldwide, it will continue to do so. We will be learning how to live with it. One important part of that is vaccines. I’m pleased to say that there is good progress that’s being made. Many vaccines now have shown they generate an immune response of a type that ought to be protective, and several vaccines are in very late stage clinical testing, aiming to show that they are both effective and safe. The UK, through the Vaccines Task Force, has got access to a number of these, as illustrated on this slide, with a range of different vaccine technologies from a number of different companies. The UK therefore has put itself in a good position in terms of vaccine supply, and the possibility that one of these will work. We don’t yet know that they will work, but there is increasing evidence that it’s pointed in the right direction, and it’s possible that some vaccine could be available before the end of the year in small amounts, for certain groups, much more likely that we’ll see vaccines becoming available over the first half of next year. Again, not certain but pointed in the right direction, which then of course gives the possibility of a different approach to this virus, but in the meantime, we’ve got to get on control, control of this in the way that Chris has described in order to make sure we can live with it in a way that is sustainable and protects health and society overall. Thank you very much.